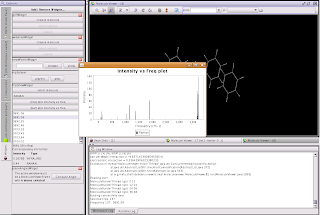
The long story: you and write a widget, and well good thing is that I myself wrote it ;) You can get the widget here [freqViewWidget.bsh].
To use this widget:
- make sure you have the latest version (2.0.24022009) or higher
- download the above script
- use the Add/Remove Widget button on the Widgets panel to install the widget
- Optionally open it in code editor (in meta studio) and click on "Make Widget" button
- the widget should appear in the Widgets panel.
- next open a molecule file as usual in meta studio
- then click on select molecule in widget, select the molecule with freq data
- then i guess its pretty straight forward ;)
So how does it look?

And I guess the graph (generated from jfreechart API which are shipped with MeTA Studio), looks pretty too .. try it out and let me know!

Have fun!
No comments:
Post a Comment